Spring Has Sprung! Or Has It? The Math Behind Seasons
Yawn! That’s not my reaction to the title, but to the sleepiness that comes from giving up Lent, eating chocolate (provided at half price by Safeway on Easter Monday), and sleeping in after a sugar rush. Easter, is a Spring holiday – not by chance, but by design: Spring officially starts on the Spring equinox, and Easter falls on the first Sunday after the first full moon after the Spring equinox (unless bla bla). Since there is one full moon in every 29-something days, you are guaranteed to see Easter happen soon after the official start of Spring.
Yet, because I am a nerd, the first thing that comes to my mind is not Christ, the Lord and Savior returning, it’s not bunnies and chocolate, and it’s not even the painful reminder that the snowboarding season is almost over. In fact, the first thing that comes to my mind about every three months at the change of seasons is, “but the season has long started!”
Yes, all of March is relatively mild, despite the fact the first two thirds are officially winter. It’s the exact same thing for all seasons: June is already hot as all get-go, except maybe in San Francisco and Fairbanks, AK. September is my favorite month, and the hottest in San Francisco – but it’s the hottest there precisely because temperatures dip to its East. And finally, the cruelest joke of all, Christmas is close to the coldest day of the year, but it’s just the beginning of winter.
What’s the deal? Why do we assign some random point about a third of the way into the season as its beginning?
Let’s take the Winter solstice, traditionally falling around the 21st of December. It is the day with the shortest daylight duration. Before it the days were longer, and after it they will be shorter. Since our Earth relies on imported heat from the sun, the shortest daylight should coincide with the least heat. The coldest day of the year should be the Winter solstice!
Things aren’t that quick, since it takes the atmosphere some time to adapt to change, sort of like it’s been caught doing the naughties with the sun and needs to straighten out her dress. But, in fact, at least in Denver, the coldest day of the year is December, 26th, not even a week after the solstice. It is in fact very odd that we consider what should be the exact middle of winter, the beginning. Even when taking into account heat inertia, it makes very little sense to consider the solstice the beginning of the season instead of its middle.
But it’s convenient. The dates of equinoxes and solstices are constant, we need a day to start the seasons, might as well pick something that is somewhat related to them (even if the day picked should be the middle of the season by logic). Generally, it feels like the seasons should align more with the months (all of December, January, and February in winter, all of March, April, and May in spring, etc.), but who cares?
Well, your resident nerd cares. I went and decided I was going to compute when the seasons really begin and how long they really last!
First of all, there are different ways of determining seasons. The most common one involves temperatures, and that’s the one I am following. But of course there are wet and dry seasons, foggy seasons, and even hunting seasons (although those are not strictly related to climate). I like the temperature definition, because (a) the data is freely available, and (b) wetness and fog affect the temperature, thus leaving their footprint in the temperature.
Second, seasons are not the same everywhere on Earth. Everybody knows that the Southern hemisphere has opposite seasons than the Northern, and that the Tropics pretty much have no seasons to speak of. But it’s also true that different locations even at the same Northern or Southern latitudes can have different temperature variation norms, which is how I’d define a season. San Francisco, for instance, is famous for its summer fog that keeps temperatures way down. Because of it, the city has an unseasonably long “spring” and the hottest months are what would normally be the Fall.
OK, so what we want to know is a definition of seasons for a specific location. How do we do that?
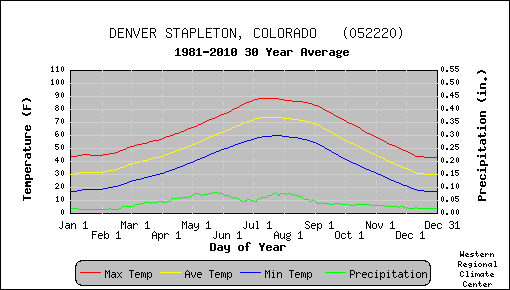
First, we look at what nature offers as a model. The temperature curve for a specific location can look like this:

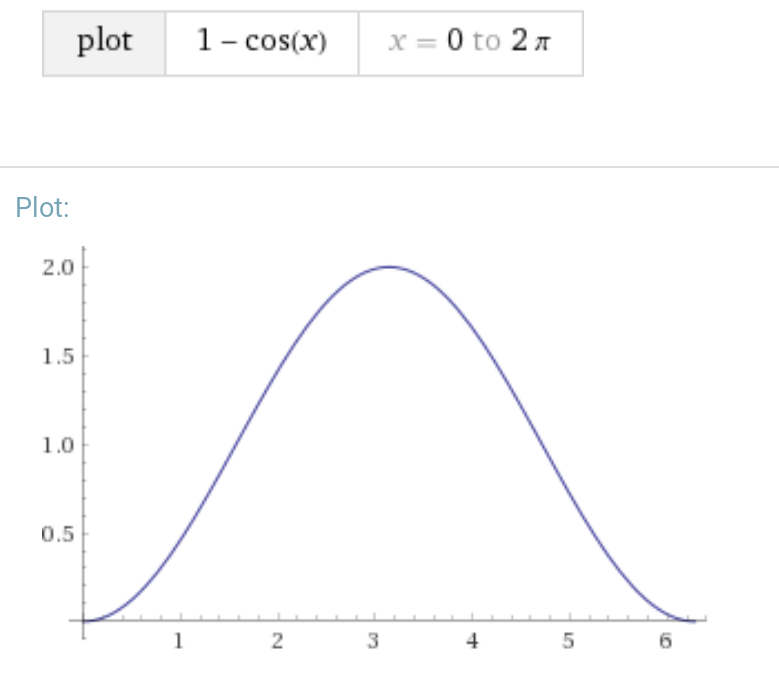
The curve goes from about its lowest level at the beginning of the year (and of January) to a maximum some time in the middle of July. The curve closes around the ends and creates a loop. Thus it is called a periodic function. Math provides cool periodic functions like this, the most commonly used ones being the trigonometric functions. (Oops, did I lose you???) Here is what a somewhat similar trig function looks like:

(The image was generated by Wolfram Alpha. Generating the plot of a simple trigonometric function is about the easiest thing Alpha can do, and I can’t laud that software and service enough!)
Aside from different scales and colors, the red, yellow, and blue lines above roughly behave like the blue line below. They start at the bottom, then they rise faster and faster, then they plateau and fall back (in the Fall, no kidding!). You will notice that the ascending curves in the temperature data are longer than the descending ones. That means that spring, the time of rising temperatures, will be longer than fall. You can also see that the three upper curves (that denote max, average, and min temperatures) all behave with regularity and consistently. The green curve at the bottom, on the other hand, is a bit random, having a maximum in late May and then again at the beginning of August, with the shameful fact Denver gets no real snow in the winter recorded by the minimum between December and March.
Also, notice that the plateaus in the winter and the summer are not equal. The winter has a much harder time warming up than the summer cooling off, keeping with the slower warming up of the spring. Finally, how about that oddness, shared by summer and winter, that the initial part of the seasons is much shorter than the final?
Where did I get this temperature data? It’s from the Western Regional Climate Center, an insanely important resource, especially for weirdos like me that decide where to live in (large) part based on weather data. WRCC provides accurate data for a range of locations in the Western United States, including a freely available daily data set. For Denver Stapleton, you find it here.
Scanning the data set with your own eyes (under “Daily Tabular data”), you’ll notice the temperature maximum and minimum: it never gets hotter (on average) than 88.8F, which happens on July 14th or 15th; it is never colder on average than 43.0F, which can occur on any of the days from 12/23 to 12/27. I told you, Christmas is the coldest day of the year in Denver!
That part is really easy. Much harder to spot is the beginning of each season (which is also the end of the one before it). That’s particularly hard because the seasons are not symmetric around the coldest and hottest days, so you can’t just count one half of a season (365 days / 4) before and after. So, what do we do?
Well, we take a hint from math. If the curve I pictured above, 1 – cos x, represented days in x and temperatures in y after shifting and transforming, how would we determine the duration of the seasons?
Notice how with the function, we can easily determine winter and summer (and as a consequence fall and spring), since they are perfectly symmetrical around the minimum and maximum. We know that this is the ideal case, so the seasons would also be ideal and all last the same amount of time. The period of the function is 2 pi, so each season is a quarter of that, or pi / 2. Finally, winter or summer go one half one side of the minimum and one half the other, so we are considering the value at x = pi / 4. Insert that into the function and we get y = 1 – cos(pi / 4) = 0.2928... Since the entire range is 0 – 2, the value of y represents 0.1464 or about 15% of the total temperature variation.
Let’s apply this to Denver. We saw that the temperature ranged from 43.0 to 88.8. That leaves us with a temperature variation of 45.8 degrees. 15% if that on top of winter minimum gets us to balmy 49.8, and taken off from the summer max to still hot 81.9. So, we will define winter as every day from 43.0 to 49.8, summer as every day between 81.9 and 88.8, and spring and fall will be the seasons between the two.
I wrote up a Tcl script to do the calculations, then re-did the same in Python, and here is the final output:
Data for DENVER STAPLETON, COLORADO
Maxima range from 43.0 on 12/23 to 88.8 on 7/15
Temperature variation is 45.8, which means winter is from 43.0 to 49.87 and summer from 81.93 to 88.8.
Season: From   To      Days     Min.    Max.
Winter: 11/25  2/24    90       43.0F   49.7F
Spring: 2/24   6/16    113      49.6F   81.9F
Summer: 6/16   9/6     82       81.6F   88.8F
Fall:   9/6   11/25    80       49.7F   81.6F
Notice that the temperatures don’t seem to align perfectly: for instance, the hottest day of spring is not the coldest day of summer, because the coldest day of summer is the last, not the first. The difference is small, but confusing at first. (I though there was a problem with the calculations.)
Once that’s cleared up, the first thing of note is the variation in duration of the seasons. Spring is by far the longest, more than 20 days longer than it “should” be. Winter is almost exactly the right length (365/4 being a little more than 91), and summer and fall are shorter than they should be – by about a week and a half, each.
But what about other locations? Are they the same? I would expect the weirdest seasonal variation to come from Coastal California, because the onset of summer cools things off on the coast. San Francisco’s Richmond District, part of the infamous Fog Belt on the West side of town, has the following output:
Season: From    To      Days    Min.    Max.
Winter: 12/11   1/22    41      57.0F   58.3F
Spring: 1/22    8/30    221     58.4F   64.5F
Summer: 8/30    10/28   59      64.4F   65.8F
Fall:   10/28   12/11   44      58.3F   64.4F
As suspected, the Spring is insanely long. 221 days is more than half the entire year. Notice how, oddly, the summer goes from the end of August to the end of October. Fall and winter are both super-short, which is pretty much how San Francisco feels. In Oakland across the bay, less than 10 miles away, the spring is already just 207 days long. By the time we cross the low Bay Area hills and get to Mt. Diablo Junction, the seasons are back to normal and the Spring just 108 days.
What about other places? San Diego? The data for the airport, Lindbergh Field, says that the temperature variation is just 12.6 degrees, so there aren’t going to be seasons to speak of. Their duration, though is about normal for other locations in the Western U.S.:
Winter: 12/3    3/26    113     64.9F   66.8F
Spring: 3/26    7/22    118     66.8F   75.6F
Summer: 7/22    9/22    62      75.5F   77.5F
Fall:   9/22    12/3    72      66.8F   75.5F
The summer is shorter than usual, thanks to the stupid May Gray and June Gloom (in fact, much of July is not part of summer).
How about something really exotic? Honolulu? No, better, Laupahoehoe, where I used to go swimming on the Big Island:
Winter: 11/22   1/13    51      70.3F   72.1F
Spring: 1/13    7/5     174     72.7F   80.3F
Summer: 7/5     10/24   111     80.2F   82.1F
Fall:   10/24   11/22   29      72.1F   80.2F
Strangely, the temperature variation here is 11.8 degrees, which is not significantly smaller than in San Diego. I guess San Diego really has the best climate! Notice how here, also, the spring is strangely long: that’s a consequence of the North-Easterlies, the dominant spring-time winds that cool down the islands and bring tons and tons of rain.
How about the Northern-most place I could find on the list? That’s Barrow in Alaska. Unsurprisingly, the winter is very long, 120 days, and is all sub-zero (Fahrenheit, brr….). The coldest day is about half-way through winter in February!!!
Portland, OR? Long spring, Feb-Jul. (June is very wet, there.) Phoenix, AZ? Long spring and summer, and a large temperature variation of 40 degrees, which is still a lot smaller than in Denver. South Lake Tahoe has long winters and even longer springs, while Las Vegas (both are in Nevada, if only partially in the case of the former), is about average on season duration, but has an insane yearly temperature variation of 48.4, which tops (although not by a whole lot) that of Denver.
To top this all off, what about locations that are not in the Western U.S.? I found that NOAA has data sets that are freely downloadable (but not posted – you have to request them and then you get an email that allows you to download them). I modified my script to read that format, and here is what I got for New York, Central Park:
Data for NY CITY CENTRAL PARK NY US
Maxima range from 34.9 on 01/21 to 89.0 on 07/18
Temperature variation is 54.1, which means winter is from 34.9 to 43.0 and summer from 80.9 to 89.0.
Season: From    To      Days    Min.    Max.
Winter: 12/13   02/18   66      34.9F  43.0F
Spring: 02/18   06/16   119     43.0F  80.9F
Summer: 06/16   08/24   69      80.8F  89.0F
Fall:   08/24   12/13   111     43.0F  80.8F
Notice that this temperature variation dwarfs even desert locations like Las Vegas. I assume the main reason is that the climate in New York is “bipolar:” the winter is dominated by North-Westerly storms from Alaska, while the summer by hot, humid moisture from the South.
