
Addendum to PPR: Actual Numbers
In the previous post I made the claim that the Percentage of Premiums Returned (PPR) is the one number that all insurance companies should give us, so that we have a better idea of what we are buying. I also made the unsubstantiated claim that the PPR is shockingly low, despite a wealth of web sites (strangely affiliated with the insurance industry) claiming that the cost of payout frequently exceeds premiums. Who’s right?
Well, since many insurance companies are publicly traded, it’s easy enough to figure out. You just have to go to the company web sites and look for the financials. I felt like I really should do that, and picked the first insurance company that sounded big enough and well-known enough. Methodology: I searched of the largest insurance companies in the U.S. and got this list. There, I looked up the first insurance company that would insure things like autos and condos, since that’s a better comparison than life insurance (which has an investment element to it.) The biggest one was State Farm, which I happen to know from their extensive advertising.
I then searched for the company financials, as disclosed, and got this link. Now, I stress that I chose State Farm simply because it was the first one on the list. I do not think it is particularly good or bad as an insurance company, and the numbers are probably just typical of any insurer. So please no State Farm bashing!
The numbers are very short and to the point. I would post the PDF capture, but who knows what evil copyright violation that would cause. So go out and verify that I am not cooking the numbers.
| Summary of Operating Data (In Millions of Dollars) | $ |
|---|---|
| Premium Earned | 33,210 |
| Less: Dollars for Claims | 21,523 |
| Expenses for Paying Claims | 5,240 |
| Service and Administrative Fees | 8,026 |
| Investment Gain and Other Income | 3,070 |
| Income Taxes Incurred | (34) |
| Net Income | 1,525 |
Note: lines omitted are simply summations of lines above or 0.
As you note, the premiums earned are $33.210 billion, while the claims paid out are $21.523 billion. That means the PPR is a paltry 65%. For every dollar you give your insurance company, you get in average 65 cents back. Still, that’s a lot better than other forms of insurance (that would probably die out quickly if they had to publish that number). Notice that there is no adjustment for the duration of payout, which would dent the PPR further.
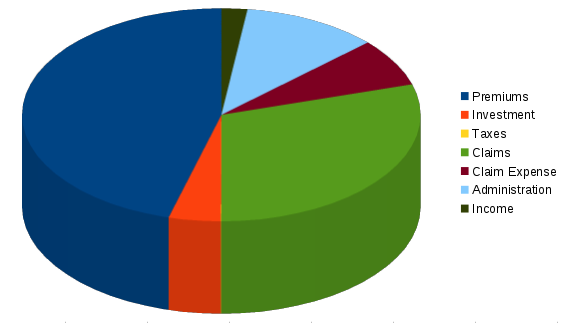
If you look at the numbers above, you see State Farm has two sources of income, premiums and investment gains. (There was a small tax return, so that adds to the income.) There are three sources of expense, of which premiums paid are about 60%. Here a chart summarizing the whole thing:
The charts splits exactly in half down the middle, because on the left we have all forms of income, and on the right all forms of expenses (for the purposes of the chart, the income counts as expense). As you see, premiums are much bigger than claims. But what about the other forms of expense?
It turns out they are separated out in two: there are expenses related to claims – the processing of claims, claim adjustment, etc. – and administration, which includes sales, marketing, HR, highly paid executives, etc. The proportions of these are:
Claims: 59%
Administration: 22%
Expenses: 15%
Income: 4%
(Floating remainder assigned to maximum value)
As you see, the claim that investment income covers all the expenses of an insurance company other than claims is complete baloney. Even if you assign the category, claim expense, to the claims, you still see that the company income and the administrative cost eat up a good chunk of premiums.
So, you see, it is true: even a good corporate player like State Farm, in a very competitive environment like consumer insurance, still makes really good money by returning only 35% of the dollars you pay it. Imagine what the hokey players in the field do.